Giving Facts

Fact 1
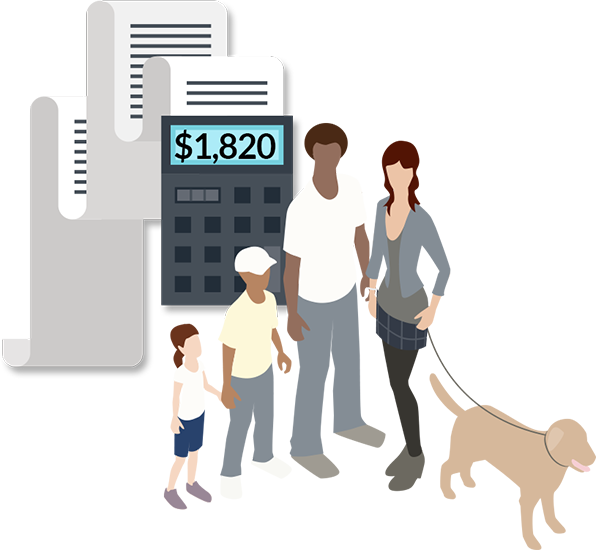
The average Canadian family that claimed donations on their tax return gave $1,820.4
Fact 2
33% of Canadian families and individuals that filed their taxes claimed charitable donations; that's 3% fewer than in 2010.4

Fact 3
Charities play diverse roles in building our social fabric and safety net. 49% of Canadian donors give to charities in the social services category and 36% give to those in the health category.3
Fact 4
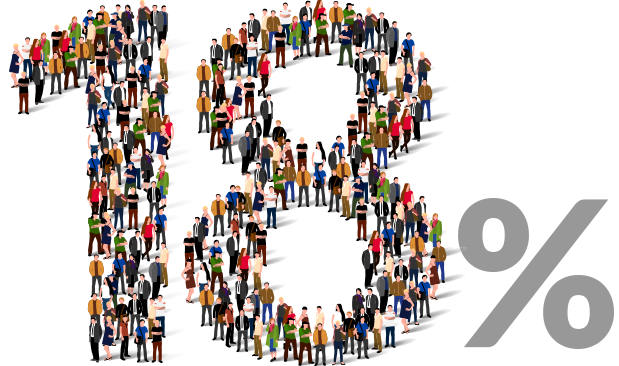
18% of Canadian donors give to religious charities.3

Fact 5
Just 1% of Canadian donors give to charities serving Indigenous peoples, 7% to those protecting the environment, and 9% to those in the arts & culture category.3
Fact 6
Those with an annual income of $150-$199K earn 7.5 times more in income than those with less than $20K in annual income, but give just 2.5 times more in donations.4

Fact 7
Manitoba has the highest percentage of families and individuals that claim donations.4
Fact 8
Alberta has the highest average donation amount.4

Fact 9
Monthly donations now represent 15% of all donated dollars and 33% of the number of donations processed by CanadaHelps. Monthly donors are more loyal and give almost two times more than one-time donors.3
Fact 10
There is a true seasonal nature to giving. Each year, 35% of giving happens in December — 10% on the last three days of December alone.3


|
|
Data Sources and Clarifications |
Appendix A: Data Sources and Clarifications
Throughout The Giving Report 2017 site, downloadable report and accompanying data tables, we include a reference number indicating the data source. Information on each data source, and relevant disclaimer or clarification information, is provided below. Where data has been adjusted for inflation, the Bank of Canada Inflation Calculator (http://www.bankofcanada.ca/rates/related/inflation-calculator/) has been used. The data source is Statistics Canada, CONSUMER PRICE INDEXES FOR CANADA, MONTHLY (V41690973 series.) CAGR is used in the accompanying tables and refers to Compound Annual Growth Rate.
DATA SOURCE 1:
Canada Revenue Agency, T3010 Registered Charity Information Return information from CRA as of June 2017.
Disclaimer from CRA
The information (in whole or in part) in this package has been provided by an information technology provider. Efforts have been made to ensure that the information contained herein is correct. The Charities Directorate is not responsible for the quality, accuracy, reliability or currency of the information contained in this package.
Statistics and data are produced or compiled by the Charities Directorate for the sole purpose of providing Canadians or individuals with direct access to public information about registered charities in Canada.
The CRA is not responsible for the use and manipulation by any persons of this information.
DATA SOURCE 2:
Labour force survey estimates (LFS), by sex and detailed age group
Statistics Canada, CANSIM, table 282-0002
DATA SOURCE 3:
Donations made using CanadaHelps.org
DATA SOURCE 4:
Statistics Canada, Income Statistics Division, T1 Family Files 2006 to 2015, Reference 17052
Postal Code Validation Disclaimer
The geography in T1FF request are derived based on an amalgamation of Postal CodeOM. Statistics Canada makes no representation or warranty as to, or validation of, the
accuracy of any Postal CodeOM data.
Family Type
Family Type reflects data from Statistics Canada classified as Census Family
Individual Resident
Individual Resident reflects data from Statistics Canada classified as Non-Census Family
Income Data
In some cases, reported zero values may actually reflect data not provided by Statistics Canada, typically due to an insignificant amount data.